


Section of the valley we want to compute volumes on (shown here is one of the levels)
This tutorial presents a method to calculate volume(s) of a valley.
Obviously that volume depends on the elevation we want to compute the volume from (see image above).
Let's say that valley bottom is at 100 m, top of surrounding hills is at 250 m and, more importantly, the lowest elevation between hills surrounding the valley is at 190 m. Now, obviously again, volumes can only be calculated from 100 m to 190 m. There is no point to compute a volume above 190 m because it will encompass a volume much larger than the true volume of the valley (think of filling the valley with water, once you reach 190 m, the water starts spilling over to surrounding valleys!).
WARNING! The method presented below is not that much accurate. Accuracy depends on the DEM cell size.
On the software side we need:
On the data side we need (image below):
DEM.tif AOI.shpROI.shp
The following steps are used to calculate volumes:
DEM.tif to ROI.shp [Processing -> GDAL -> Clip raster by mask layer] -> ROI.tifAOI.shp as AOI.CSV file.Znn, where 'nn' is the level value, one for each level, fill each column with the level value, see below:
AOI_pg.shpgdal_rasterize -a Znn -ot Float32 -tr 5 5 -a_nodata -9999 -co COMPRESS=DEFLATE -co PREDICTOR=1 -co ZLEVEL=6 -l AOI_pg AOI_pg.shp nn.tifHere
-tr 5 5 is the cell size (5x5 m) of ROI.tif. Again, the accuracy of the volume calculation is very much dependent on this value. gdalwarp -ot Float32 -q -of GTiff -dstnodata -9999 -cutline ROI_pg.shp -crop_to_cutline
-co COMPRESS=DEFLATE -co PREDICTOR=1 -co ZLEVEL=6 nn.tif area-nn.tifgdal_calc --calc "((A-B)<0)*(A-B)*-1.0" --format GTiff --type Float32 --NoDataValue -9999 -A ROI.tif --A_band 1 -B Area-nn.tif --B_band 1--outfile Diff-area-nn.tif
Diff-area-nn.tif files into QGIS.Volumes.xlsx)

Steps 5 to 7 are automated in dosur.bat and surfaces.bat
dosur.bat
   @echo off
   for %%A in (89 87 85 83 81 79) DO call surfaces.bat %%A
replace the values within the parenthesis with your level values.
surfaces.bat
   @echo off
   echo Computing isosurface for level %1
   if exist %1.tif del %1.tif
   gdal_rasterize -a Z%1 -ot Float32 -tr 5 5 -a_nodata -9999 -co COMPRESS=DEFLATE
      -co PREDICTOR=1 -co ZLEVEL=6 -l AOI_pg AOI_pg.shp %1.tif

   echo Computing clipped isosurface for level %1
   if exist area-%1.tif del area-%1.tif
   gdalwarp -ot Float32 -q -of GTiff -dstnodata -9999 -cutline ROI_pg.shp
      -crop_to_cutline -co COMPRESS=DEFLATE -co PREDICTOR=1 -co ZLEVEL=6 %1.tif area-%1.tif

   echo Computing height differences for level: %1
   if exist Diff-area-%1.tif del Diff-area-%1.tif
   gdal_calc --calc "((A-B)<0)*(A-B)*-1.0" --format GTiff --type Float32
      --NoDataValue -9999 -A ROI.tif --A_band 1 -B area-%1.tif --B_band 1
      --outfile Diff-area-%1.tif
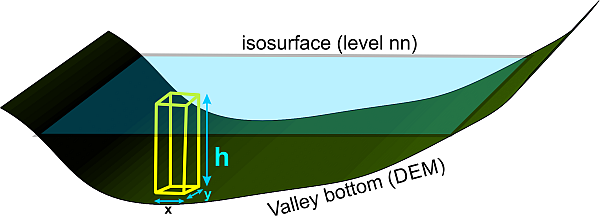
For each grid cell of the isosurface that is above the DEM we calculate the height difference (h - step 7 above). We save all those height differences in the Diff-area-nn.tif and we get the sum of all the heights from the raster metadata (step 10 above).
Now we multiply the cell size (x.y) by that value to get to the volume.
Note that the larger (x.y) is the less accurate the calculated volume is.
MS Excel is used to do volume calculation, but any spreadsheet program can be used.

The Volumes.xlsx sheet
There are only two formulas to compute the volume:

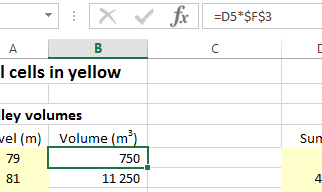
The Excel spreadsheet can be downloaded here: Volumes.xlsx
Footnote:
This method is obviously very rough but it gives far more plausible results than volumes derived from other algorithms.
I've tried SAGA grid volume algo in Processing and Golden Software Surfer algo on my dataset but volume values were not what I was expecting!
After Binging the web I've found this page that I've used to derive the method described above.
Published date: 01 Apr 2016.