

A simple workflow to create watersheds and streams networks from SRTM data.
Final product shows delineated basins in different colours as well as drainage network of area of interest.

Save as.... Then define the coordinates system.Following steps will be done in SAGA:
Results
First step is to process SRTM data in order to correct for irregularities in slope values. Raw SRTM data does not flow smoothly along real slopes, instead elevation values along a real stream profile create dumps and holes along that profile. To correctly compute stream network it is thus necessary to fill all sinks along streams path.
By-product from this step in a watershed raster grid. This is one product of interest.
Geoprocessing -> Terrain Analysis -> Preprocessing -> Fill Sinks (Wang Liu):

Results

This step is a preliminary computation to get to streams networks.
Geoprocessing -> Terrain Analysis -> Hydrology -> Flow Accumulation -> Flow Accumulation (Top-Down):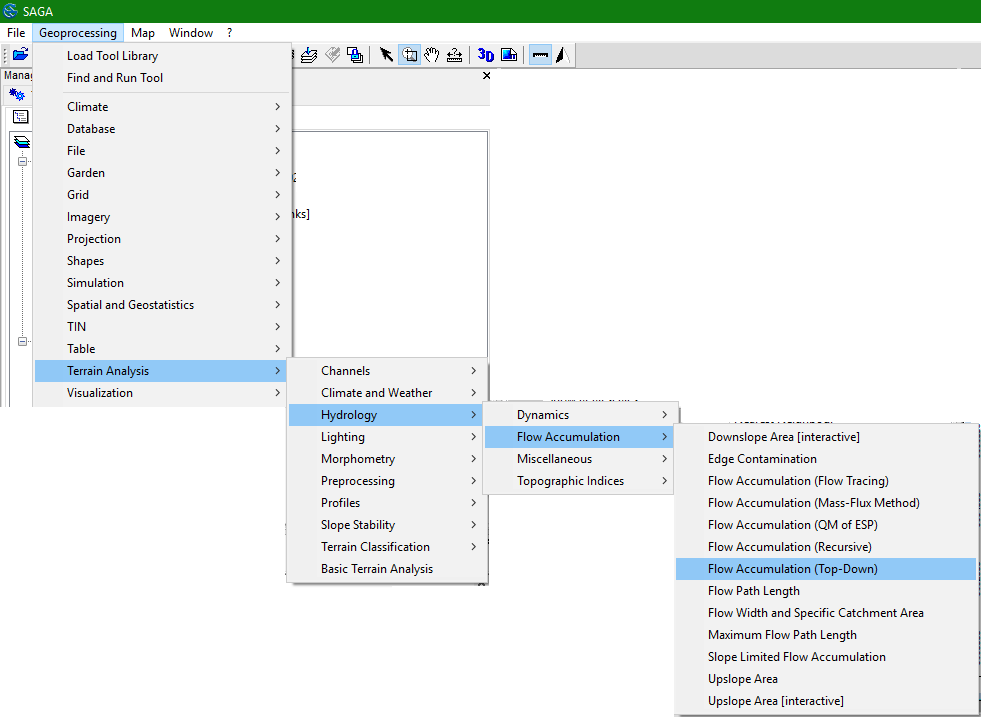

Results

Open Flow Accummulation map, move mouse over map and note that in dark blue areas (streams) accumulation values are generally very high (> 1 000 000). This fact will be used in next step.
In this step a river network is created from flow accummulation data. This is the second product of interest.
Geoprocessing -> Terrain Analysis -> Channels -> Channel Network:

Results
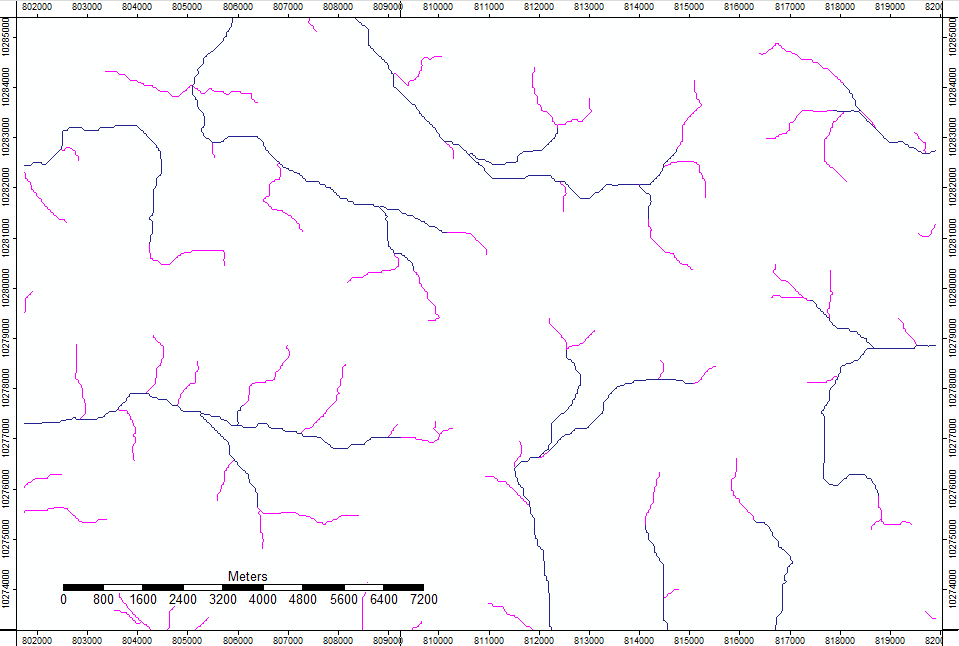
Channel Network - vector. Dark blue: IT = 3 000 000; Fushia: IT = 1 000 000
Initiation Treshold (IT) value can be changed to obtain more or less detailed channel network.
Save everything to disk. SAGA creates lots of files. The ones used by QGIS are .sdat files.
Following steps will be done in QGIS:
SAGA has created a shapefile for the stream network. Locate it (*.shp - Channel Network_1.shp) in File Explorer and drag it to QGIS canvas.
Style it to represents rivers/streams.
SAGA also created a watersheds file (by default Watershed Basins.*). Locate Watershed Basins.sdat and drag it to QGIS canvas.
Watersheds are shown in different shades of grey:

Watersheds raster file is to be converted to shapefile using Raster -> Conversion -> Polygonize (Raster to Vector)...:


Results

At edges of OUTPUT there are lots of badly defined watersheds, simply because there is not enough data there! As area of interest lies in map centre, only relevant basins will be kept.
With selection tool  , select basins of interest (9 here), and then inverse selection.


Enter edit mode  and delete
  all selected. Done!

To conclude this workflow, watersheds basins vector file is to be saved to disk and styled.

Opacity slider is shown with Properties -> Legend -> Available widgets -> Opacity slider ->  -> Used widgets -> OK
Final products from this workflow are streams networks and watersheds in the area of interest, as shown below:

Published date: 08 Sep 2019.